Excel Tips and Tricks / Business Reporting Question: How do I create an interactive report that can quickly be used to summarize large amounts of data?
Answer: By using a Pivot Table
Why: A PivotTable report is useful to summarize, analyze, explore, and present summary data. A PivotTable enables you to make informed decisions about critical data in your enterprise.
Applies To MS Excel 2003, 2007, 2010
1. Refer to the data as given in the example below.
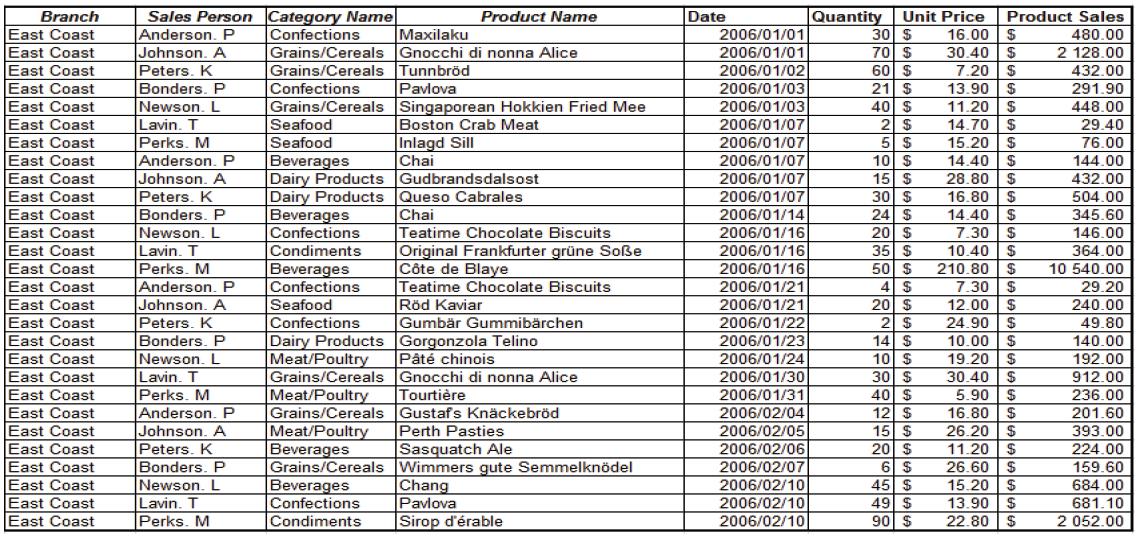
2. Select any cell in the list.
3. From the insert tab, in the tables group, select pivot table and click Ok.
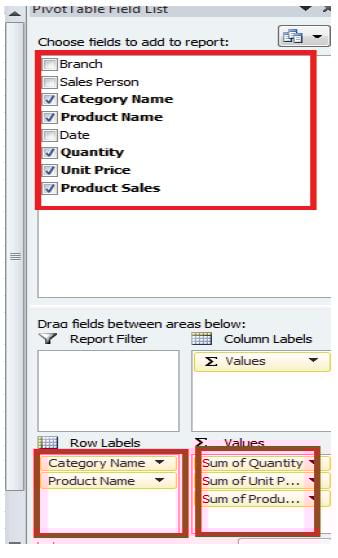
4. Drag the category name and product name fields to the row labels area.
5. Drag the quantity, unit price and product sales fields to the values area as given below.
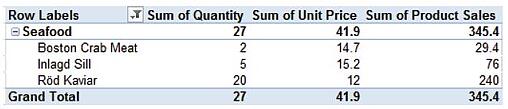
6. To display data for the products under the sea food category; select the drop down arrow under row labels and select sea food as below.
7. The following pivot table will be given.
The data given in step 1 above can be summarized and queried in many user friendly ways.
The Design of a PivotTable allows you to:
- Query large amounts of data in many user-friendly ways.
- Subtotal and aggregate numeric data, summarize data by categories and subcategories, and create custom calculations and formulas.
- Expand and collapse levels of data to focus your results, and drill down to details from the summary data for areas of interest to you.
- Move rows to columns or columns to rows (or "pivoting") to see different summaries of the source data.
- Filter, sort, group, and conditionally format the most useful and interesting subset of data to enable you to focus on the information that you want.
- Present concise, attractive, and annotated online or printed reports.
Notes:
How a PivotTable Field List Works
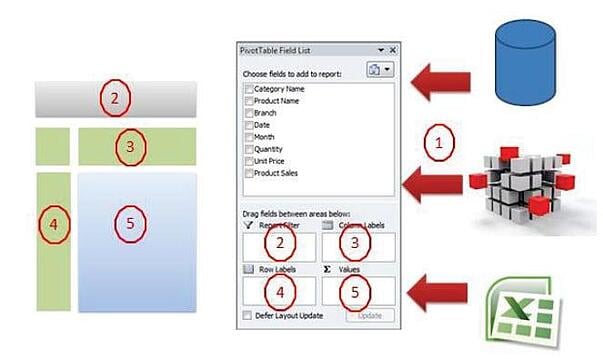
1. Data Source (Excel, Cube, Database)
2. Report Filter (Department)
3. Column Label Area (Branch)
4. Row Label Area (Customer Name)
5. Value Areas (Sales Amount)
For more Excel Tips and Tricks, please search our blog! We are sure you'll find what you're looking for.
Should you require any further assistance regarding business software solutions, and are located in the Greater Chicago, IL area - please contact us for a consultation. It would be our pleasure to be of any assistance.

 © 2019 PositiveVision • 219 E. Thorndale Ave. Roselle, IL 60172