Excel Tips and Tricks / Business Reporting Question: I need to export the stock list to our database program for further analysis. Last time I tried the routine, the names of the products were truncated because the wrong field size was used in the table. How can I return the number of characters in a text string? This will enable me to identify the maximum number as the field size when designing the table in the database.
Business Automation and Software Blog
Topics: Business Reporting, Excel Tips and Tricks
Excel Tips and Tricks / Business Reporting Question: I usually export my inventory data into Excel for further analysis. However the products names appear in upper case when I do this. Is there a way of converting the product names to lowercase and then capitalizing each word – how do I do this in Excel?
Topics: Business Reporting, Excel Tips and Tricks
Excel Tips and Tricks: Multiple Data Consolidations for Pivot Tables
Excel Tips and Tricks / Business Reporting Question: As an effective tool for working with large volumes of data, I usually use PivotTables to summarize, organize and view the same data in many different ways quickly and easily. However the data is usually in one data source/range. Is it possible to create a PivotTable based on multiple data consolidation ranges?
Topics: Business Reporting, Excel Tips and Tricks
Excel Tips and Tricks / Business Reporting Question: Is it possible to view different parts of the data worksheet at the same time? For instance when I import the payroll summary report from the payroll system, I would like to see the top ten & bottom ten earners. We have over five hundred employees on our payroll and this analysis is crucial in identifying the trends in our payroll.
Topics: Business Reporting, Excel Tips and Tricks
Excel Tips: Publishing a Workbook to an Intranet/Internet Location
Excel Tips and Tricks / Business Reporting Question: We have adopted a policy in our company where the financial director is expected to publish quarterly financial results to the server/Intranet. This can then be read by all the concerned parties. However we only want to send a static copy of the statement/s. Is there an option in excel that we can use to achieve our desired result?
Topics: Business Reporting, Excel Tips and Tricks
Excel Tips and Tricks / Business Reporting Question: I usually import data from our accounts system into Excel for further analysis. The difficulty I face is that the names are combined with the initials. However I would like to analyze the data based on the initials. Is there a formula one can type so as to extract the initials quickly, given that the initials appear on the right side of the names?
Topics: Business Reporting, Excel Tips and Tricks
Excel Tips and Tricks: Using the DATEIF Function
Excel Tips and Tricks / Business Reporting Question: Is there a function in Excel that I can use to calculate the number of days between 2 dates. I would like to work out the number of days between an invoice date and invoice payment date.
Topics: Business Reporting, Excel Tips and Tricks
Excel Tips and Tricks: Using Filtering Options
Excel Tips and Tricks / Business Reporting Question: I am using Excel 2007 for my sales report. I know I can use the Report Filter in the PivotTable to filter all the sales data. Is there a way that you can just filter a specific Row field as I would like to filter my sales data by Date only?
Topics: Business Reporting, Excel Tips and Tricks
Using Excel to Improve Financial Business Reporting
In today’s business market, access to timely and accurate information is crucial to any company’s success. Business Intelligence (BI) is crucial for all managers and executives. With the ability to pull and analyze data pertaining to the company, businesses are able to make smarter decisions and gain an understanding of where their business is heading. Wary of spending large amounts of money on a complicated BI solution, many companies have taken advantage of the abundant features Microsoft Excel offers.
Excel is one of the most effective (and least expensive) Business Intelligence (BI) tools to date. Excel not only improves financial reporting, but it will also prepare your business for success. Consider the following reasons Excel may be the solution for you:
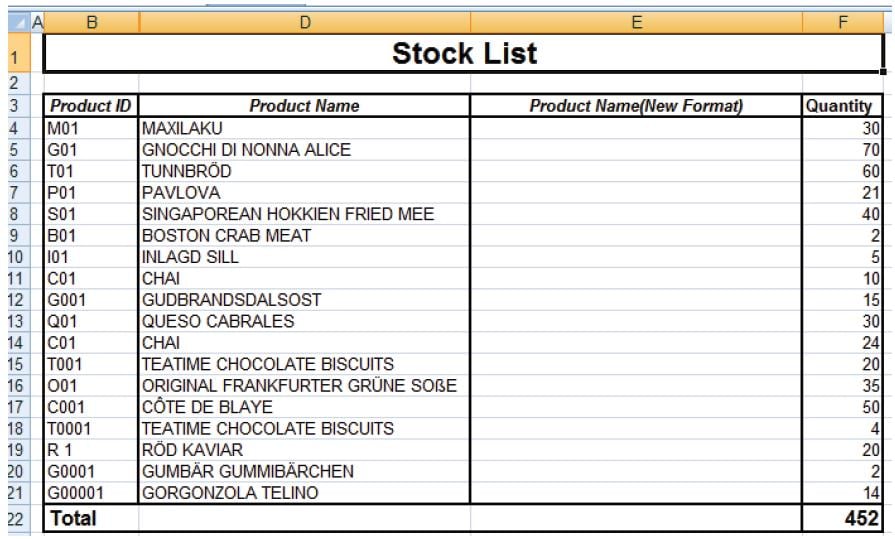
Excel Gives Users the Freedom to Fully Explore Data
While most BI solutions only allow users to view data within established boundaries, Excel has, virtually, no boundaries. Data can be explored and analyzed in any way the user sees fit. If one analytical method doesn’t produce the information the user is looking for, the data can be analyzed in a number of ways. Excel allows – and enables – users to find all the meaning they can in the data they have.
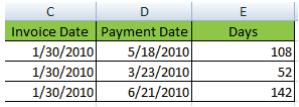
Excel Allows Users to Explore Any Type of Data in One Analysis
The data in most BI tools is stored in data warehouses. If the data isn’t in the warehouse, your BI tool cannot use it.
Excel Allows Users to Move Between Reporting and Analysis in One Easy Step
More often than not, companies do their analysis in Excel and their reporting in another program. When the report is taken to higher management and asked to be analyzed, users then have to translate their work between Excel and the other program. This not only takes up time that could be otherwise used for problem-solving, but it also reduces the amount of information managers receive.
Managers can get their answers faster if the reporting and analyzing is done in Excel. With all the data in one place, the user can effortlessly switch from reporting to analyzing in a matter of seconds.
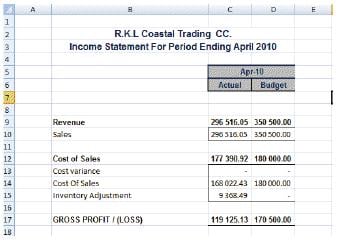
Excel Offers Superior Reporting Capabilities
If you need to change a key report significantly in order to adapt to changes in business, Excel is your answer. In Excel, reports can be changed in a matter of hours or days. If the new report isn’t quite what management wants, the user can make changes quickly rather than going through IT or another department for changes.
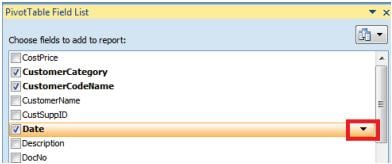
Excel Reports Offer an Unlimited Scope of Information
Many managers have a broad spectrum of responsibility and, therefore, need to see a wide variety of data, usually all at the same time. Many BI tools cannot produce reports with the data managers need. Excel dashboards, on the other hand, are quite effective. Excel can summarize many data series from a variety of data sources on just a few printed pages.
Managers can review several dozen charts and tables from a variety of data sources on one single printed dashboard page. Managers can easily compare and review the data by looking at several Excel dashboards spread out before them.
Excel greatly improves the business reporting capabilities of numerous companies world wide. It offers significant advantages for reporting, analyzing and presenting business information.
If you'd like assistance with your business reporting, please contact us today for a consultation.
Topics: Business Reporting, Excel Tips and Tricks
Business Intelligence is Not Just for Large Organizations
Business Intelligence (BI) has been a popular term for quite some time, but its exact meaning has been elusive to the public. While business intelligence encompasses a variety of different activities, BI is ultimately a tool (or rather, many tools) that helps businesses produce reports and analyze business data.
Topics: business intelligence, Business Reporting