Excel Tips and Tricks / Business Reporting Question: Is it possible to combine two or more chart types in a chart?
Answer: Yes
Why: To display the results of different sets of data in one graph
Applies To: Excel 2010, 2007, 2003:
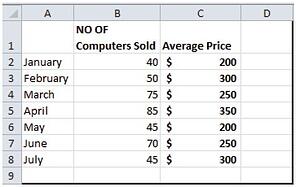
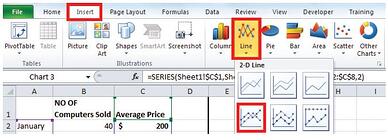
1. Refer to the data given below:
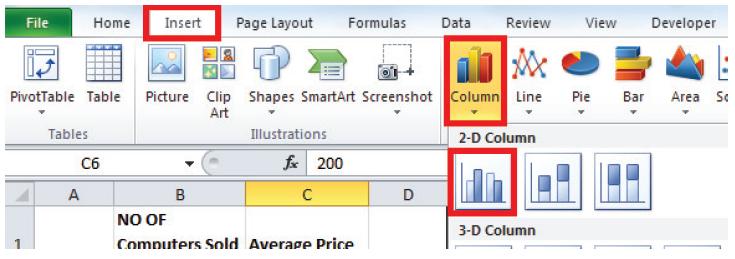
2. Select any cell within the data range.
3. Select as below:
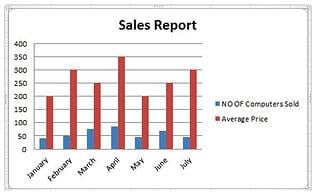
4. The following chart will be displayed:
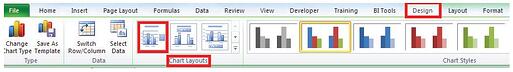
5. To insert the heading select the chart and select as below:
6. Select the average price bars in the chart and as below:
7. Two charts (line and column will be displayed).
8. Right select the line graph and select as below:
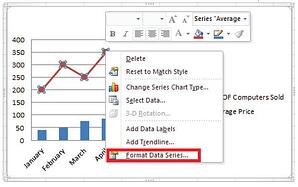
9. Select Secondary axis and then the close button.
10. The following chart will be displayed:
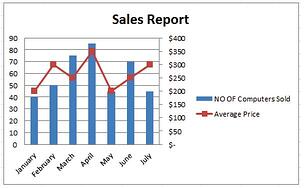
Two graphs with separate axis have been combined in one chart. Therefore one can easily interpret the different sets of data in the chart.
Contact PositiveVision ► ►
for a Complimentary
Reporting Consultation
 © 2019 PositiveVision • 219 E. Thorndale Ave. Roselle, IL 60172